Euro-Yen Pair Signals Potential 300-Pip Downward Shift
Technical indicators for the EUR/JPY currency pair suggest a significant bearish retracement may be approaching, with a potential decline of up to 300 pips.
 🧠AI Analysis
Photo: tradingview.com
Key points
- Monthly candlestick patterns indicate a bearish trend for the EUR/JPY pair.
- A potential downside of 200 to 300 pips is projected based on current technical analysis.
- Traders are being advised to monitor charts closely for positioning opportunities.
The Euro has shown signs of weakening against the Japanese Yen, with recent monthly trading patterns indicating a potential bearish shift for the currency pair. Market participants are monitoring a possible retracement that could see the pair drop between 200 and 300 pips from current levels, according to technical chart analysis.
Technical Indicators Point to Retracement
Analysis of monthly candlesticks reveals a shift in momentum, suggesting that the Euro's recent trajectory against the Yen may be reaching a turning point. This projected movement represents a notable correction in the foreign exchange market, prompting traders to re-evaluate their exposure to these major currencies. The potential 200–300 pip downside is viewed as a significant opportunity for those positioned for a bearish move.
For everyday investors, fluctuations in the EUR/JPY pair are often used as a barometer for global risk sentiment. A strengthening Yen typically suggests a move toward safer assets, while a weakening Euro may reflect changing expectations regarding European economic growth or interest rate paths. Maintaining close observation of technical charts is currently recommended for those active in the FX space.
What to watch next: Investors should monitor upcoming economic data releases from the Eurozone and Japan to see if fundamental shifts align with these bearish technical signals.
Source tradingview.com — tradingview.com/chart/EURJPY/5fTlJCMz-EURJPY-ON-A-BEARISH-TRAJECTOR… ↗
Read next
 💼Investing
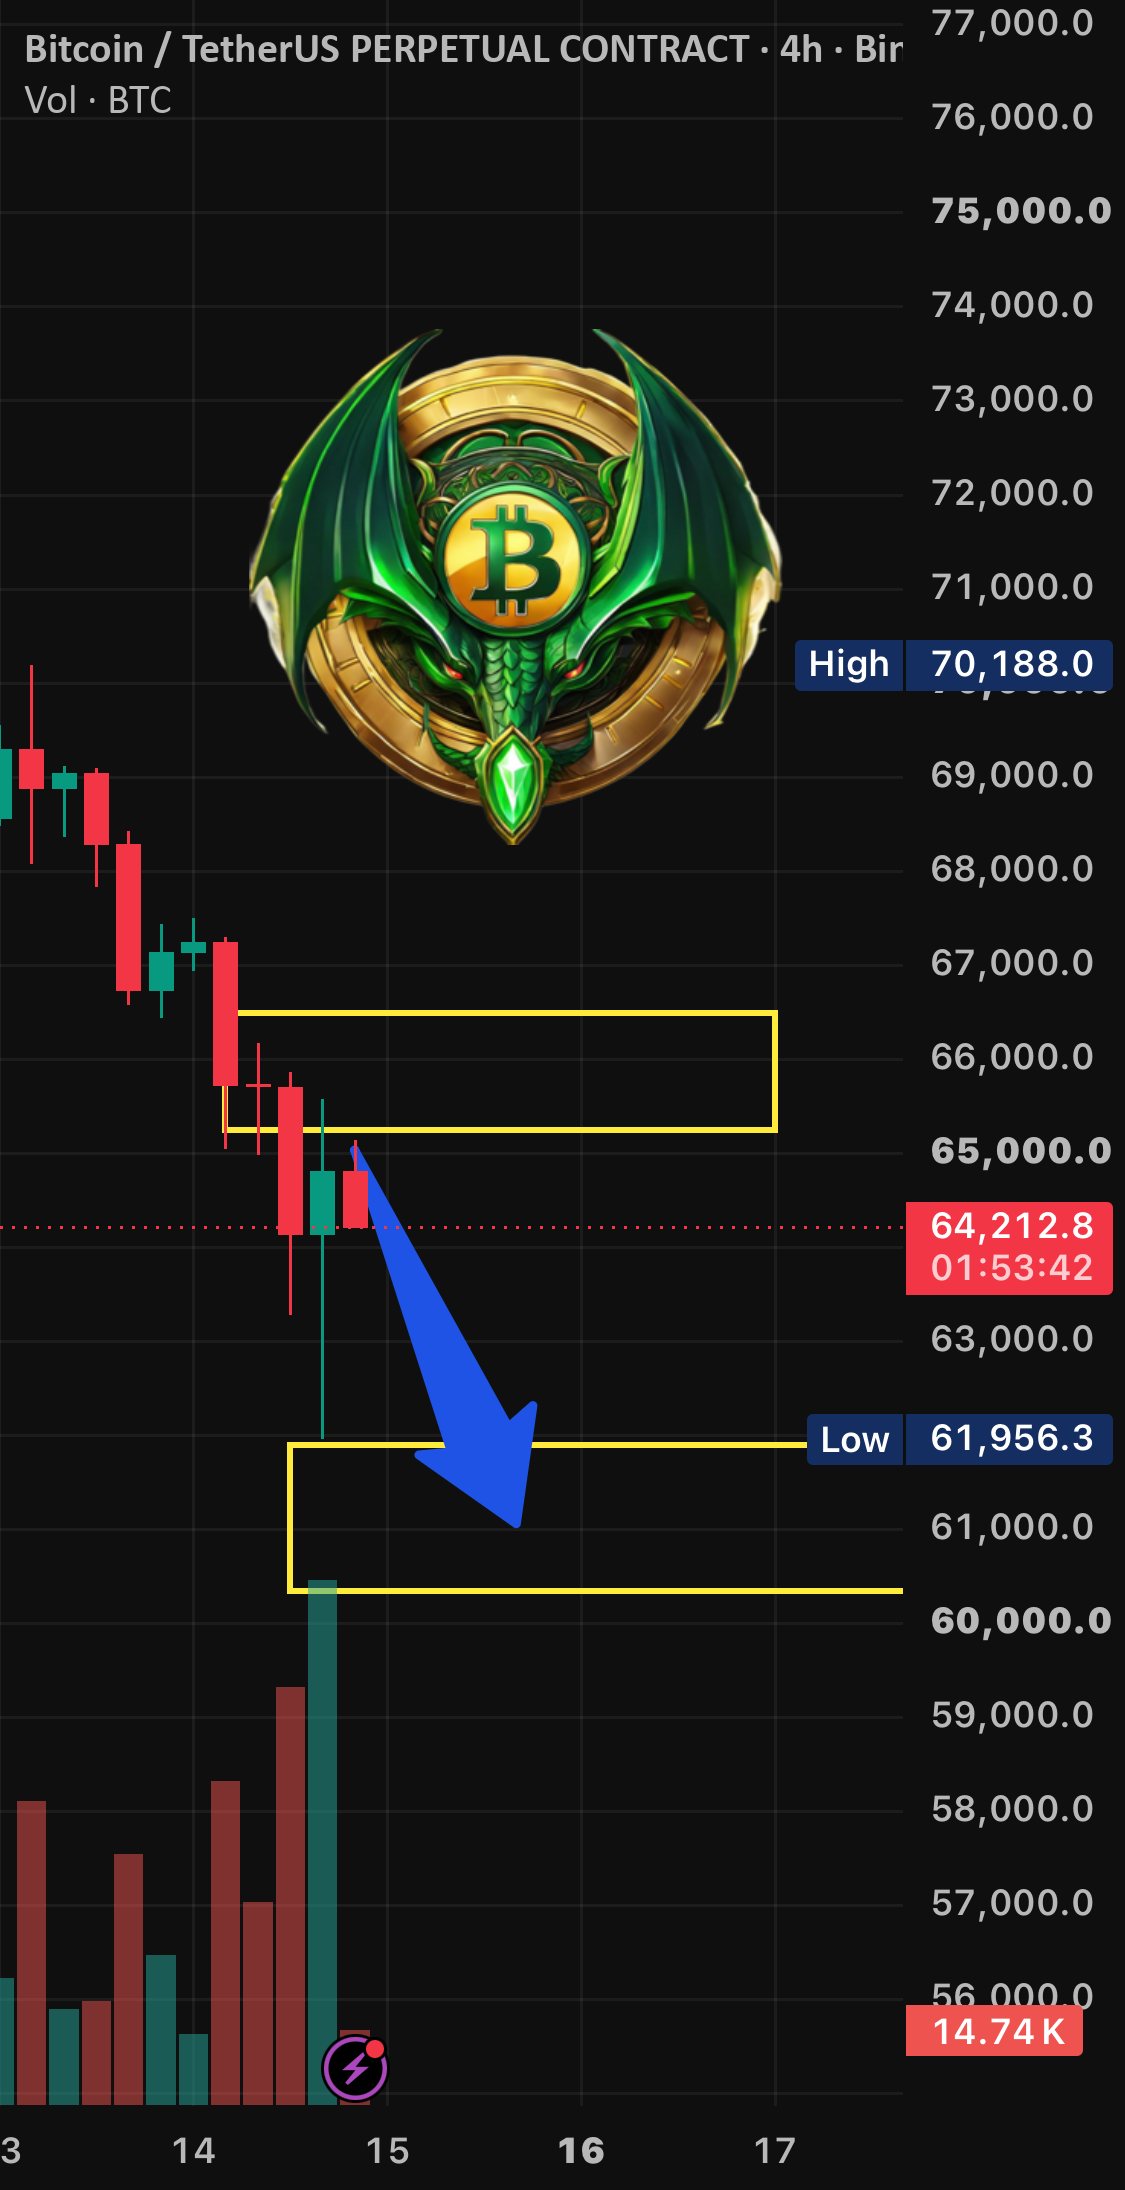
Bitcoin Faces Potential Downward Pressure as Traders Eye Key Support Levels
Market participants are monitoring Bitcoin for a potential short-term decline, with specific price targets set near the $60,000 mark.
 🧠AI Analysis
Analyst Outlines Bearish Strategy for Tesla Shares Amid Extended Downtrend
Market analysis outlines a bearish trading strategy for Tesla shares, projecting support levels between 319 and 216 through early 2027 while favoring long positions in as…
 🧠AI Analysis
Gold Technical Outlook: Key Levels and Weekly Scenarios
Gold trades near 3,885 as analysts outline competing bullish and bearish weekly technical paths.
 🧠AI Analysis
SPCX Trades Near $139 as Bulls Eye $140 Threshold
Space Exploration Technologies Corp (SPCX) traded near $139, slipping below a crucial $140 dividing line and testing short-term recovery momentum.
 🧠AI Analysis
Gold Prices Test Critical 2024 Trend Support Levels
Gold has retreated to a key technical support zone on the weekly chart, a level that has defined its upward trajectory throughout 2024.
 🧠AI Analysis
The Mechanics Behind Round Numbers and Market Liquidity
An examination of how round price levels concentrate retail stop-losses and attract algorithmic liquidity hunts in financial markets.