Bitcoin Approaches Critical Demand Zone Following Rejection From Upper Resistance
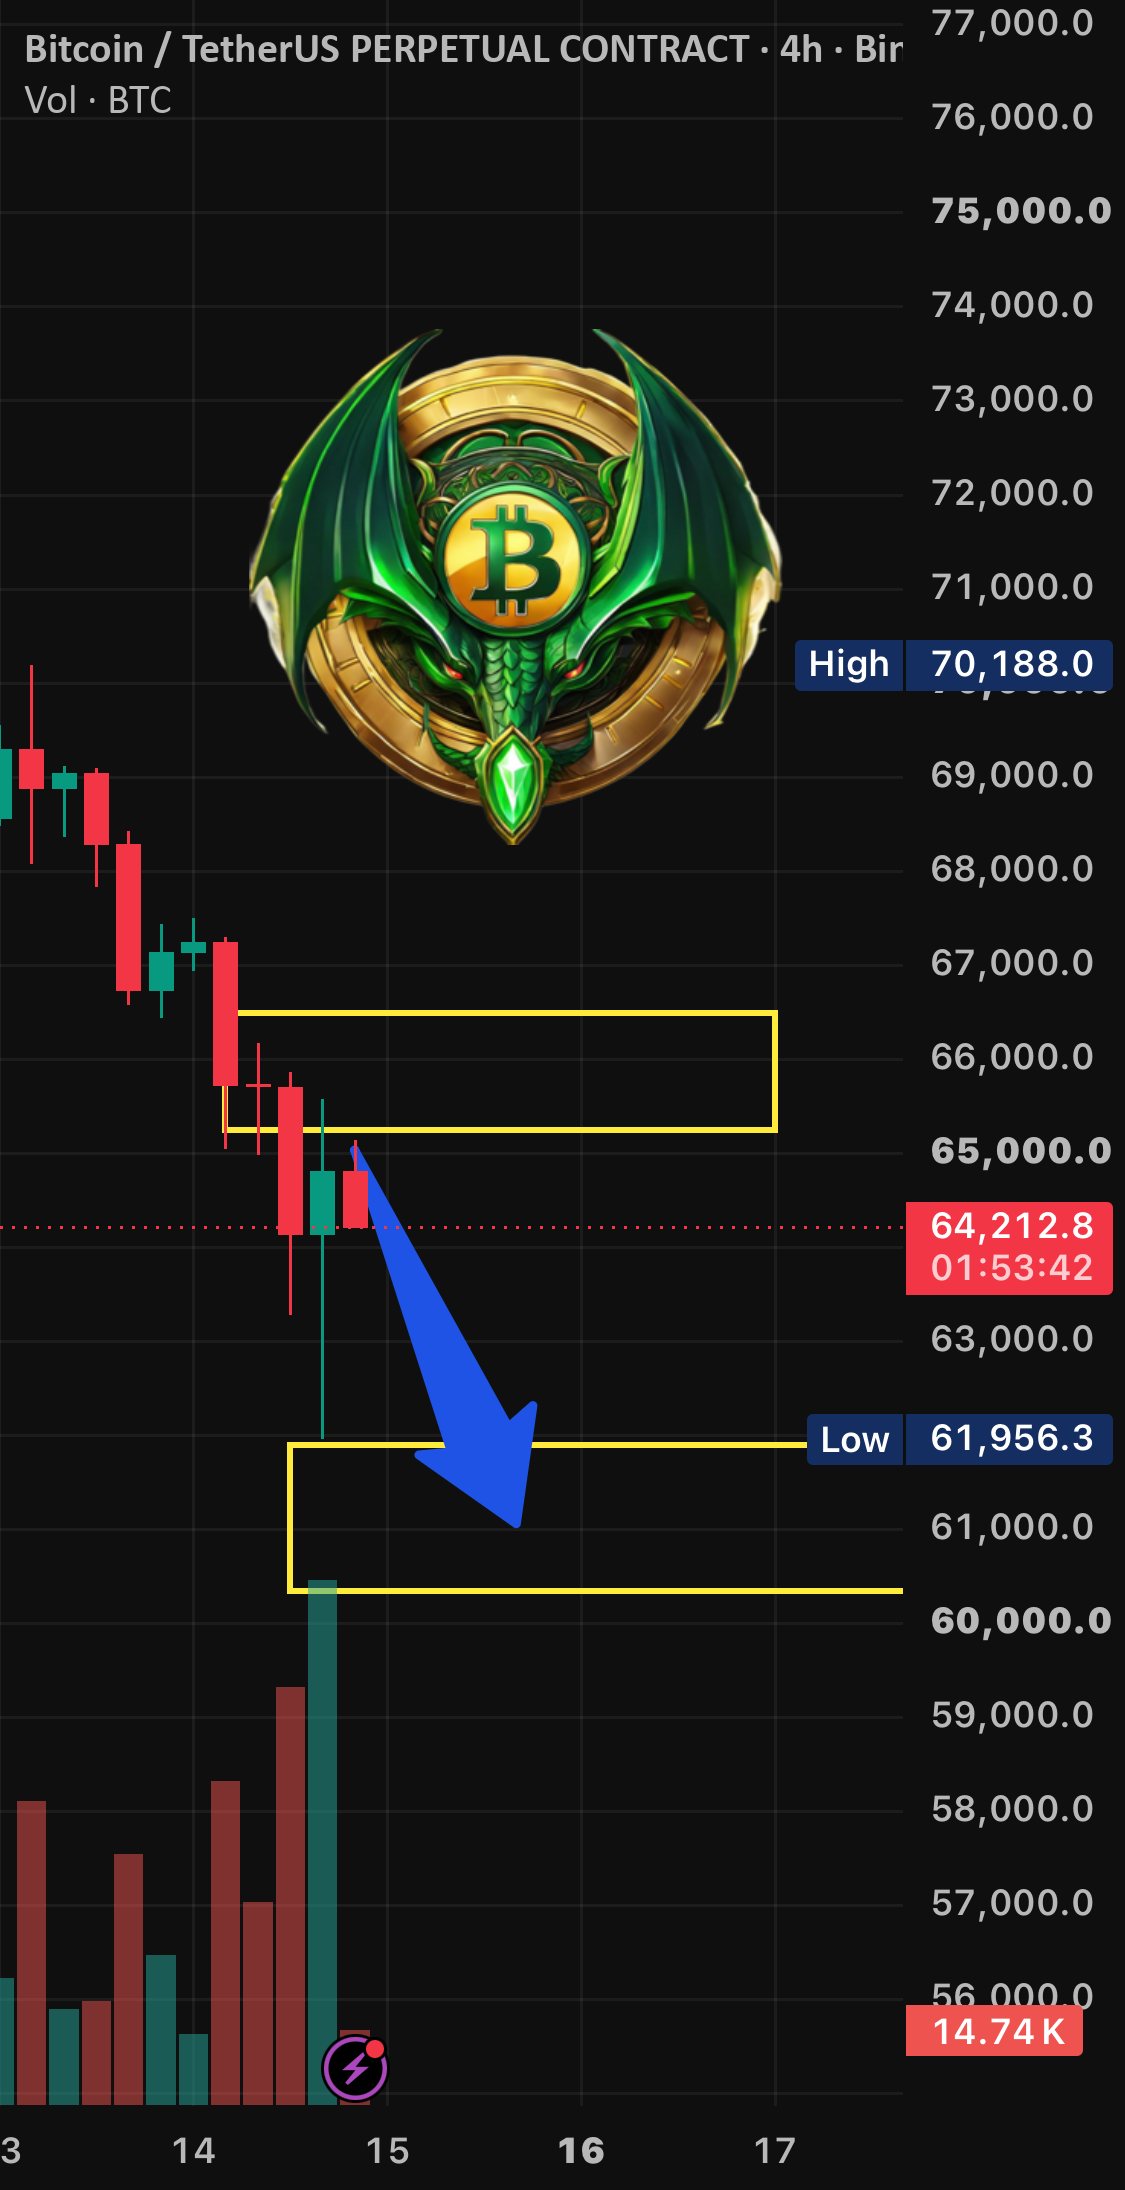
Bitcoin traded near $64,352 under ongoing bearish pressure, approaching a key liquidity zone that technical analysts watch for potential recovery signs.
 🧠AI Analysis
Photo: tradingview.com
Key points
- Bitcoin traded at $64,352 amid a broader bearish correction phase.
- The asset is nearing a critical demand and liquidity area between 60,171 and 61,248.
- Analysts emphasize waiting for confirmation signals rather than chasing volatile moves.
Bitcoin recently changed hands at $64,352, retreating significantly after failing to hold ground above its previous support structure. Technical analysis indicates that the digital asset previously faced strong selling pressure after rejecting an upper liquidity threshold near $86,515, which has shifted the 75,000 to 76,200 range into a notable resistance barrier.
Key Price Levels and Liquidity Zones
Market observers are closely monitoring lower price brackets as the token drifts toward historical demand areas. Immediate support is referenced around the 63,232 level, with broader sell-side liquidity resting near 61,248 and a potential demand reaction zone between 60,171 and 61,248. A major downside invalidation point is pegged at 57,568.
Potential Market Scenarios
Market scenarios depend heavily on how prices behave around these lower boundaries. If the asset absorbs selling pressure in the 60,171 to 61,248 region and prints a verified structural shift, a recovery toward the 76,226 resistance could materialize. Conversely, failure to defend these lower thresholds and a decisive break below 57,568 would invalidate the conditional bullish outlook and point toward extended correction.
What to watch next: Monitor lower-timeframe candle confirmations and volume behavior around the 60,000 to 63,000 demand band before anticipating any sustained trend reversal.
Source tradingview.com — tradingview.com/chart/BTCUSD/NhIhbPQ4-BTCUSD-The-Liquidity-Sweep-Be… ↗
Read next
 💼Investing
Bitcoin Faces Potential Downward Pressure as Traders Eye Key Support Levels
Market participants are monitoring Bitcoin for a potential short-term decline, with specific price targets set near the $60,000 mark.
 🧠AI Analysis
Gold Price Faces Weekly Correction After Historic Rally to 5,600
Gold prices are undergoing a notable market correction following an extended rally that previously reached peaks between 5,400 and 5,600. Everyday investors are closely m…
 🧠AI Analysis
Analyst Outlines Bearish Strategy for Tesla Shares Amid Extended Downtrend
Market analysis outlines a bearish trading strategy for Tesla shares, projecting support levels between 319 and 216 through early 2027 while favoring long positions in as…
 🧠AI Analysis
Gold Technical Outlook: Key Levels and Weekly Scenarios
Gold trades near 3,885 as analysts outline competing bullish and bearish weekly technical paths.
 🧠AI Analysis
SPCX Trades Near $139 as Bulls Eye $140 Threshold
Space Exploration Technologies Corp (SPCX) traded near $139, slipping below a crucial $140 dividing line and testing short-term recovery momentum.
 🧠AI Analysis
Gold Prices Test Critical 2024 Trend Support Levels
Gold has retreated to a key technical support zone on the weekly chart, a level that has defined its upward trajectory throughout 2024.