Gold Price Faces Weekly Correction After Historic Rally to 5,600
Gold prices are undergoing a notable market correction following an extended rally that previously reached peaks between 5,400 and 5,600. Everyday investors are closely monitoring key support zones as bullish momentum slows.
 🧠AI Analysis
Photo: tradingview.com
Key points
- Gold undergoes a weekly correction following historical highs between 5,400 and 5,600.
- The first major demand zone sits at 3,300 to 3,450, serving as a crucial test for buyers.
- Major horizontal resistance is identified at 4,400, which bulls must reclaim for a sustained recovery.
Precious metals markets are experiencing a significant corrective phase after a strong upward move that lifted gold from the 1,900 region up toward historical highs of 5,400 to 5,600. According to recent technical analysis of the weekly market structure, bullish momentum has visibly weakened as prices retreat from record levels and edge toward major support zones.
Market analysts have identified several key technical areas that could dictate the next phase for the precious metal. The immediate focal point is the 3,300 to 3,450 range, which serves as the first major demand zone. A successful defense of this area by buyers could lay the groundwork for a recovery scenario. Conversely, a failure at this level might open the door for a deeper correction toward the 2,600 to 2,800 region, with a broader historical accumulation zone sitting even lower between 2,300 and 2,500.
On the upside, horizontal resistance is firmly established around the 4,400 mark. Chart specialists note that a sustained reclaim of this critical barrier would signal improving momentum for bulls, potentially paving the way back toward higher recovery regions between 5,000 and 5,400. Volume profile data indicates that historical trading activity remains crucial for identifying potential areas of price acceptance.
What to watch next: Investors should watch how gold prices react upon testing the 3,300 to 3,450 demand region to determine if buyers can stabilize the market.
Source tradingview.com — tradingview.com/chart/XAUUSD/3hvBsK0j-XAUUSD-Weekly-Volume-Profile-… ↗
Read next
 💼Investing
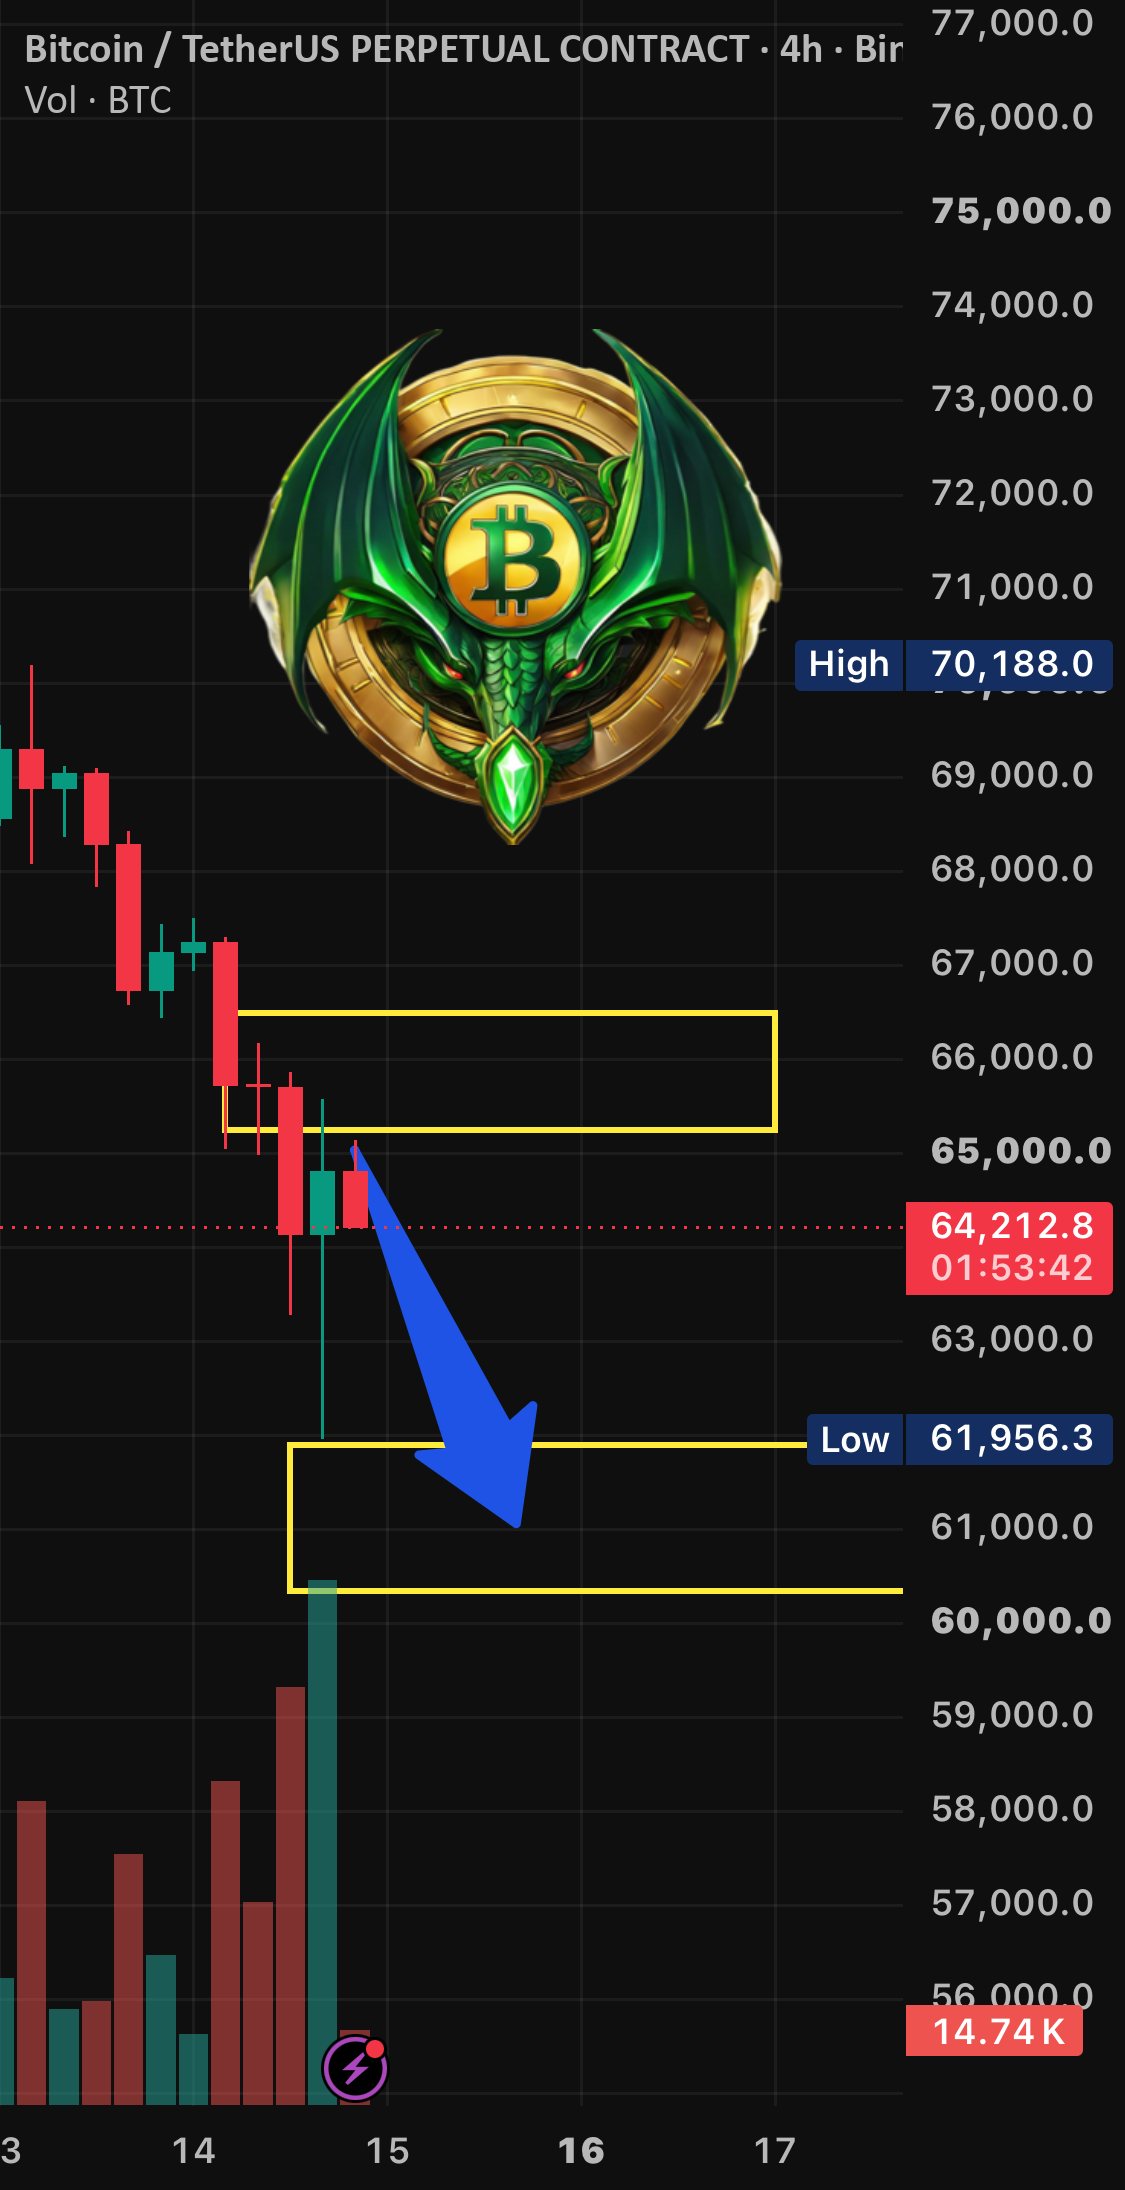
Bitcoin Faces Potential Downward Pressure as Traders Eye Key Support Levels
Market participants are monitoring Bitcoin for a potential short-term decline, with specific price targets set near the $60,000 mark.
 🧠AI Analysis
The Mechanics Behind Round Numbers and Market Liquidity
An examination of how round price levels concentrate retail stop-losses and attract algorithmic liquidity hunts in financial markets.
 🧠AI Analysis
Jindal Steel Shares Register Upward Trendline Breakout on Daily Chart
Jindal Steel Limited stock printed a daily close above a descending resistance line on November 5, 2026, catching the attention of technical chart watchers.
 📈Markets
Gold Trades Near Recent Lows Following US Inflation Data
Gold prices hovered near recent lows following the latest US Producer Price Index release, as market participants await a decisive directional signal.
 🧠AI Analysis
CNH Industrial Valued for Mid-Cycle Conditions Amid Ongoing Agricultural Downturn
Recent market assessments indicate that agricultural equipment maker CNH Industrial is currently priced for an average farm cycle rather than the cyclical bottom.
 🧠AI Analysis
Morningstar Data Shows Managed Accounts Outperforming $5 Trillion Target Date Fund Market
A new report from Morningstar indicates that managed accounts are delivering better results than the $5 trillion target date fund industry, potentially shifting the lands…